
| Deutsche Version |
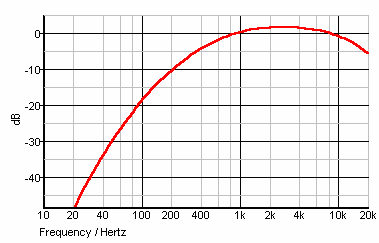
| A typical question: "What does the "a" behind the dB mean?" Since human hearing feels different frequencies as different loud, the sound signals are filtered by a sound pressure level meter so that the properties of human hearing are mimicked. We then speak of a so-called A weighting of the sound level, short dB (A). The decibel scale is logarithmic. Zero dBA corresponds to the threshold of hearing (auditory threshold). 130 dBA is about the threshold of pain. |
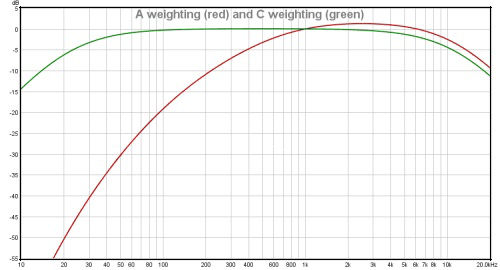
Typical question: "What is the difference between dBA and dBC?""
At sound level analyzers the display (attack time tin) is time weighted. There are different settings:
|
| Note - Comparing dBSPL and dBA: There is no conversion formula for measured dBA values to sound pressure level dBC or dBSPL. That is only possible measuring one single frequency. There is no "dBA" curve given as threshold of human hearing. |
Also no dBC measured values can be converted to dBA values.
The frequency composition of the signal is not known.
Readings of a pure 1 kHz tone should be identical, whether weighted or not.
 |
| The A-weighting filter curve is defined from 20 Hz to 20 kHz. This is intended as a rough replica of the 40 dB loudness of the curve of "equal-loudness contours" for low frequencies. That means, the cutoff low frequencies are really not measured. The display value will really be lower. Whether this is convenient, the user should decide. |
| Because of the complexity of the equal loudness contour curves one was looking for an easy simple evaluation scale and chose the A weighted curve, which reflects the course of the hearing curve for bass frequencies of the low loudness level LN = 40 phon approximately. From the noise spectrum one gets a single number, which corresponds to the real loudness at higher levels lesser and lesser. Because of the easy measuring possibility and the ease of use of this single number the industry marketing took the dBA sound pressure level measurement. |
| dBA: The decibel A filter is widely used. dBA roughly corresponds to the inverse of the 40 dB curve at 1 kHz equal-loudness curve for the human hearing. An A curve always provides for "nice" values when low frequency noise signals are included. An A filter of a measured motorcycle noise must show untrue values. You should know that. From a dBA measurement no accurate description of the expected volume is possible. The weighted sound level is neither a physiological nor a physical parameter. |
| The weighted sound pressure level is less accurate in telling the perceived loudness as a true loudness measuring, but it is much easier to handle. |
| Pro audio equipment often lists an A-weighted noise spec − not because it correlates well with our hearing − but because it can "hide" nasty hum components that make for bad noise specs. Words to bright minds: Always wonder what a manufacturer is hiding when they use A-weighting. *) |
*) http://www.google.com/search?q=Always+wonder+what+a+manufacturer+Rane&filter=0
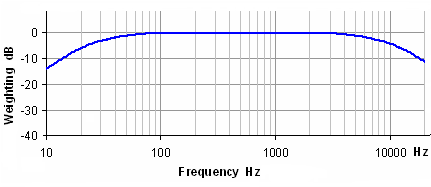
dBC: The decibel C filter is practically linear over several octaves and is
suitable for subjective measurements at higher sound pressure levels.
 |
The C-weighting filter curve is defined from 20 Hz to 20 kHz.
| The decibel A filter is widely used. dB(A) roughly corresponds to the inverse of the 40 dB
(at 1 kHz) equal-loudness curve for the human ear. Using the dBA-filter, the sound level
meter is less sensitive to very high and very low frequencies. Measurements made with
this scale are expressed as dB(A). Note! The abbreviation dBA or db(A) is not recognised by SI = International System of Units |
|
 |
How to measure sound pressure?
 |
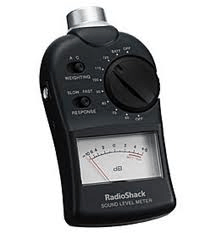
| By the way, sellers always want us to take a sound pressure level meter with digital display. But much better, however, is an analogue-to-read display − as in this figure. |
Such a meter measures the A-weighted sound pressure level (dBA). That is clear. |
Why should our ears need the sound intensity or the sound power?
Comparing dBA and dBC
| Relative Response (dB) |
Frequency f in Hz | |||||||||
| 31.5 | 63 | 125 | 250 | 500 | 1000 | 2000 | 4000 | 8000 | 16000 | |
| dB(A) | −39.4 | −26.2 | −16.1 | −8.6 | −3.2 | 0 | +1.2 | +1.0 | −1.1 | −6.6 |
| dB(C) | −3.0 | −0.8 | −0.2 | 0 | 0 | 0 | −0.2 | −0.8 | −3.0 | −8.5 |
The B-weighting curves and the D-weighting curves disappeared
ages ago from the standards. Don't use that anymore.
| In the English-speaking countries they were working with rating curves, which were independent of sound level freely selected and were designated A, B and C. The weighting scale is based on a curve at 40 phon equal loudness and is the level and frequency dependence of hearing for pure tones for quiet sounds useful. The rating curves B and C were based on higher volume levels. Weighting filter with the three curves can be easily realized using passive RC filters. 1967, agreement was reached in the International Standards Organization (ISO) on the future instead of three rating curves worldwide to only use measuring devices with A-weighting. This allowed a single international registration of noise emissions (equipment out) and pollution (arriving at the ear noise), even if the values obtained corresponded with sine tones and narrow band noises about the actual volume level. For broadband noise − this is in practice the most common − we get too low values. Because of this deviation of the results it was decided that simple devices are no longer sound meter, but only be described as sound level meter. Trade and industry were satisfied, That is why the A-weighted sound level was quickly incorporated into the legislation and noise regulations. |
 |
| ITU-R 468 noise weighting was developed to more accurately reflect the subjective
loudness of all types of noise, as opposed to tones. Noise measurements using this
weighting typically also use a quasi-peak detector law rather than slow averaging. This also helps to quantify the audibility of bursty noise, ticks and pops that might go undetected with a slow RMS measurement. ITU-R 468 noise weighting with quasi- peak detection is widely used in Europe especially in telecommunications, and in broadcasting. Its advantages over A-weighting seem to be less well appreciated in the USA and in consumer electronics, where the use of A-weighting predominates, because A-weighting produces a 9 to 12 dB "better = smaller value" specification. |
| ● Adding decibels of one-third octave bands to level of one octave band ● Levels and References of the Sound Quantities ● Conversion of sound units (levels) |
| back |
Search Engine |
home |